Hello,
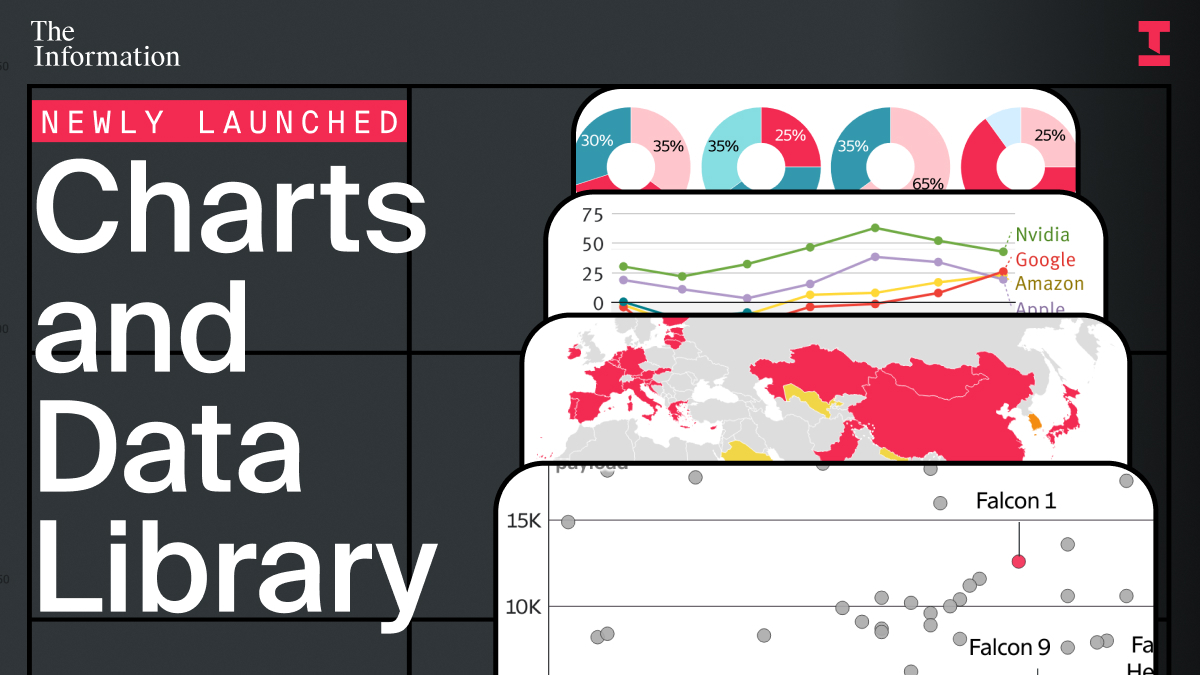
We recently launched a a searchable archive of every chart, diagram and data visual published in The Information's reporting. Our charts distill months of sourcing and analysis into a single view — clarifying how strategy, competition and valuations are shifting across tech.
Below are three charts from that library that track how AI is expanding into devices, reshaping enterprise software and resetting market expectations.
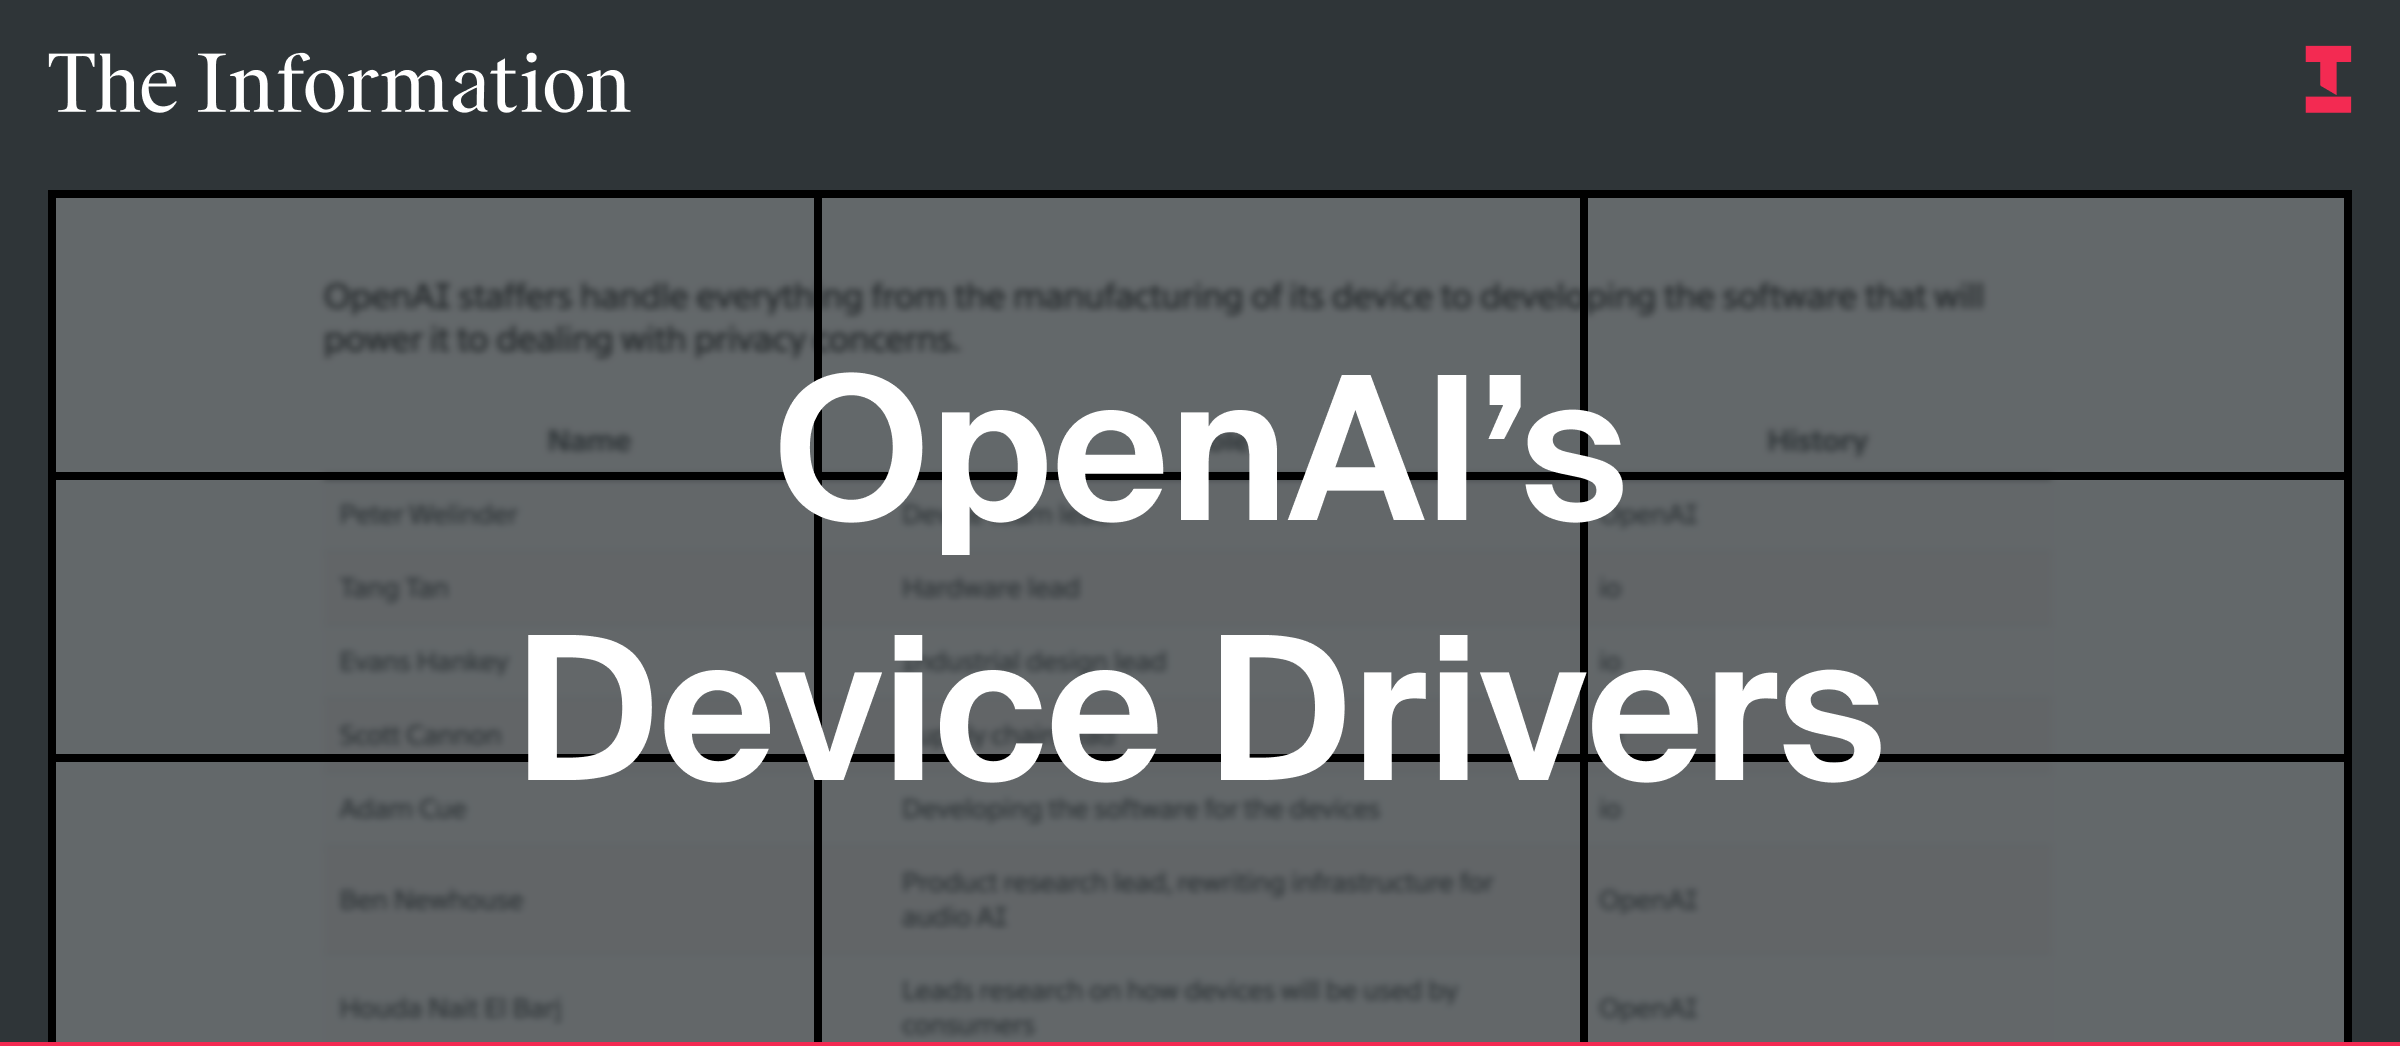
OpenAI's Device Drivers
This chart outlines the leaders behind OpenAI's device effort — spanning hardware, software, supply chain and privacy — as the company builds in-house capabilities for dedicated AI devices.
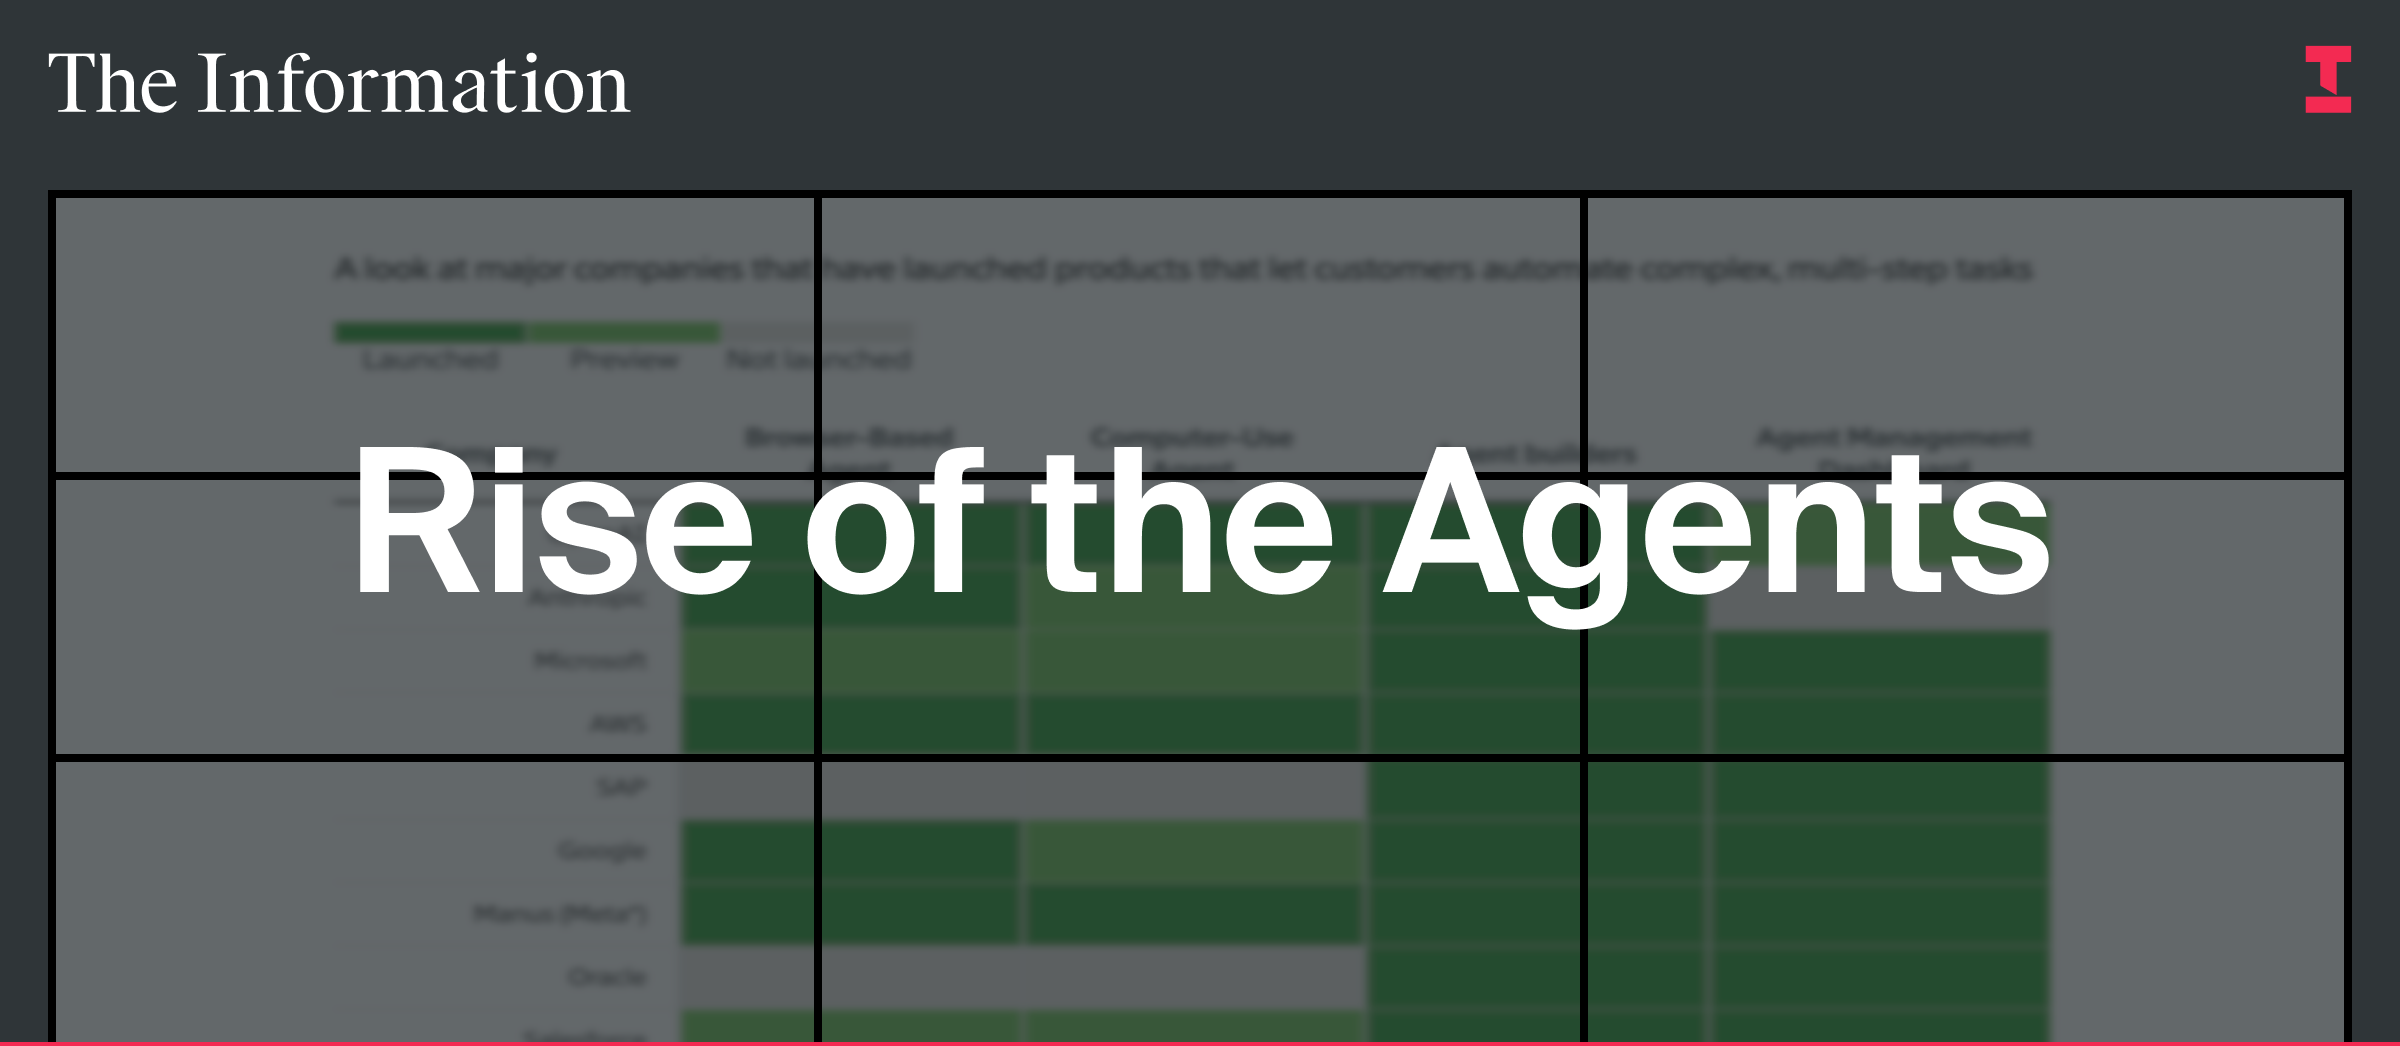
Rise of the Agents
This chart compares major tech companies across browser agents, computer-use agents, agent builders and management dashboards, highlighting who has launched products and where gaps remain.
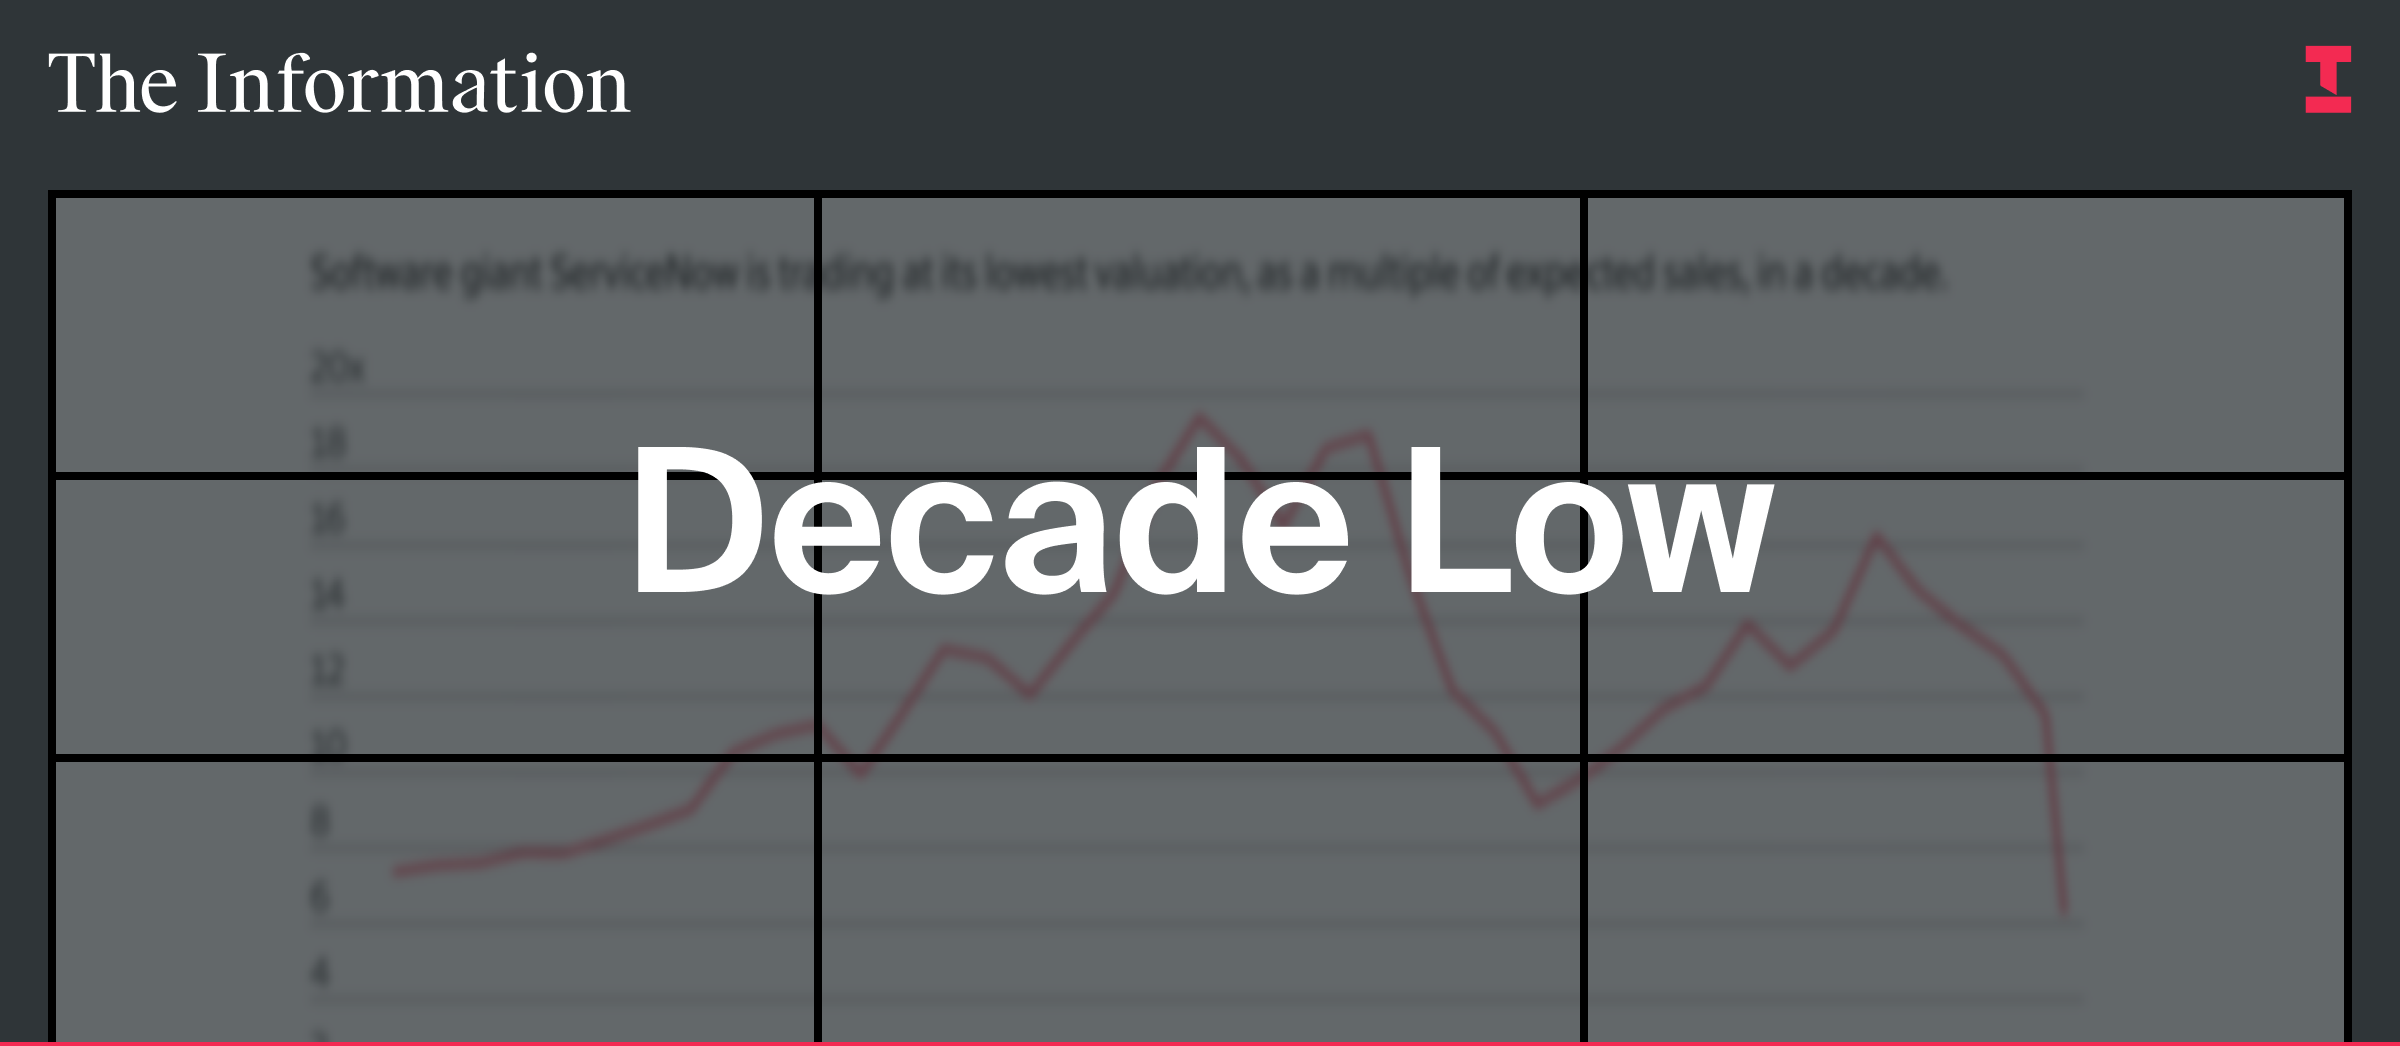
ServiceNow at a Decade Low
This chart tracks ServiceNow's valuation over time. The company is trading at its lowest sales multiple in a decade, reflecting a broader repricing of enterprise software.
Each chart lives on its own page, and is linked directly to the reporting behind it — making it easier to move from data to insight.
To mark the launch of the Charts and Data Library, new subscribers can subscribe for $399 $299 and save 25% on an Annual subscription for the first year of The Information.
If you rely on data to understand where technology and business are headed, this library is designed for you.








0 comentários:
Postar um comentário