Hello,
We recently launched a a searchable archive of every chart, diagram and data visual published in The Information's reporting. Our Our charts condense months of sourcing and analysis into a single view — clarifying how new technologies translate into business models, competition and market outcomes.
Below are three charts from that archive that track how agentic AI is moving into payments, surfacing as a competitive risk and playing out in public markets.
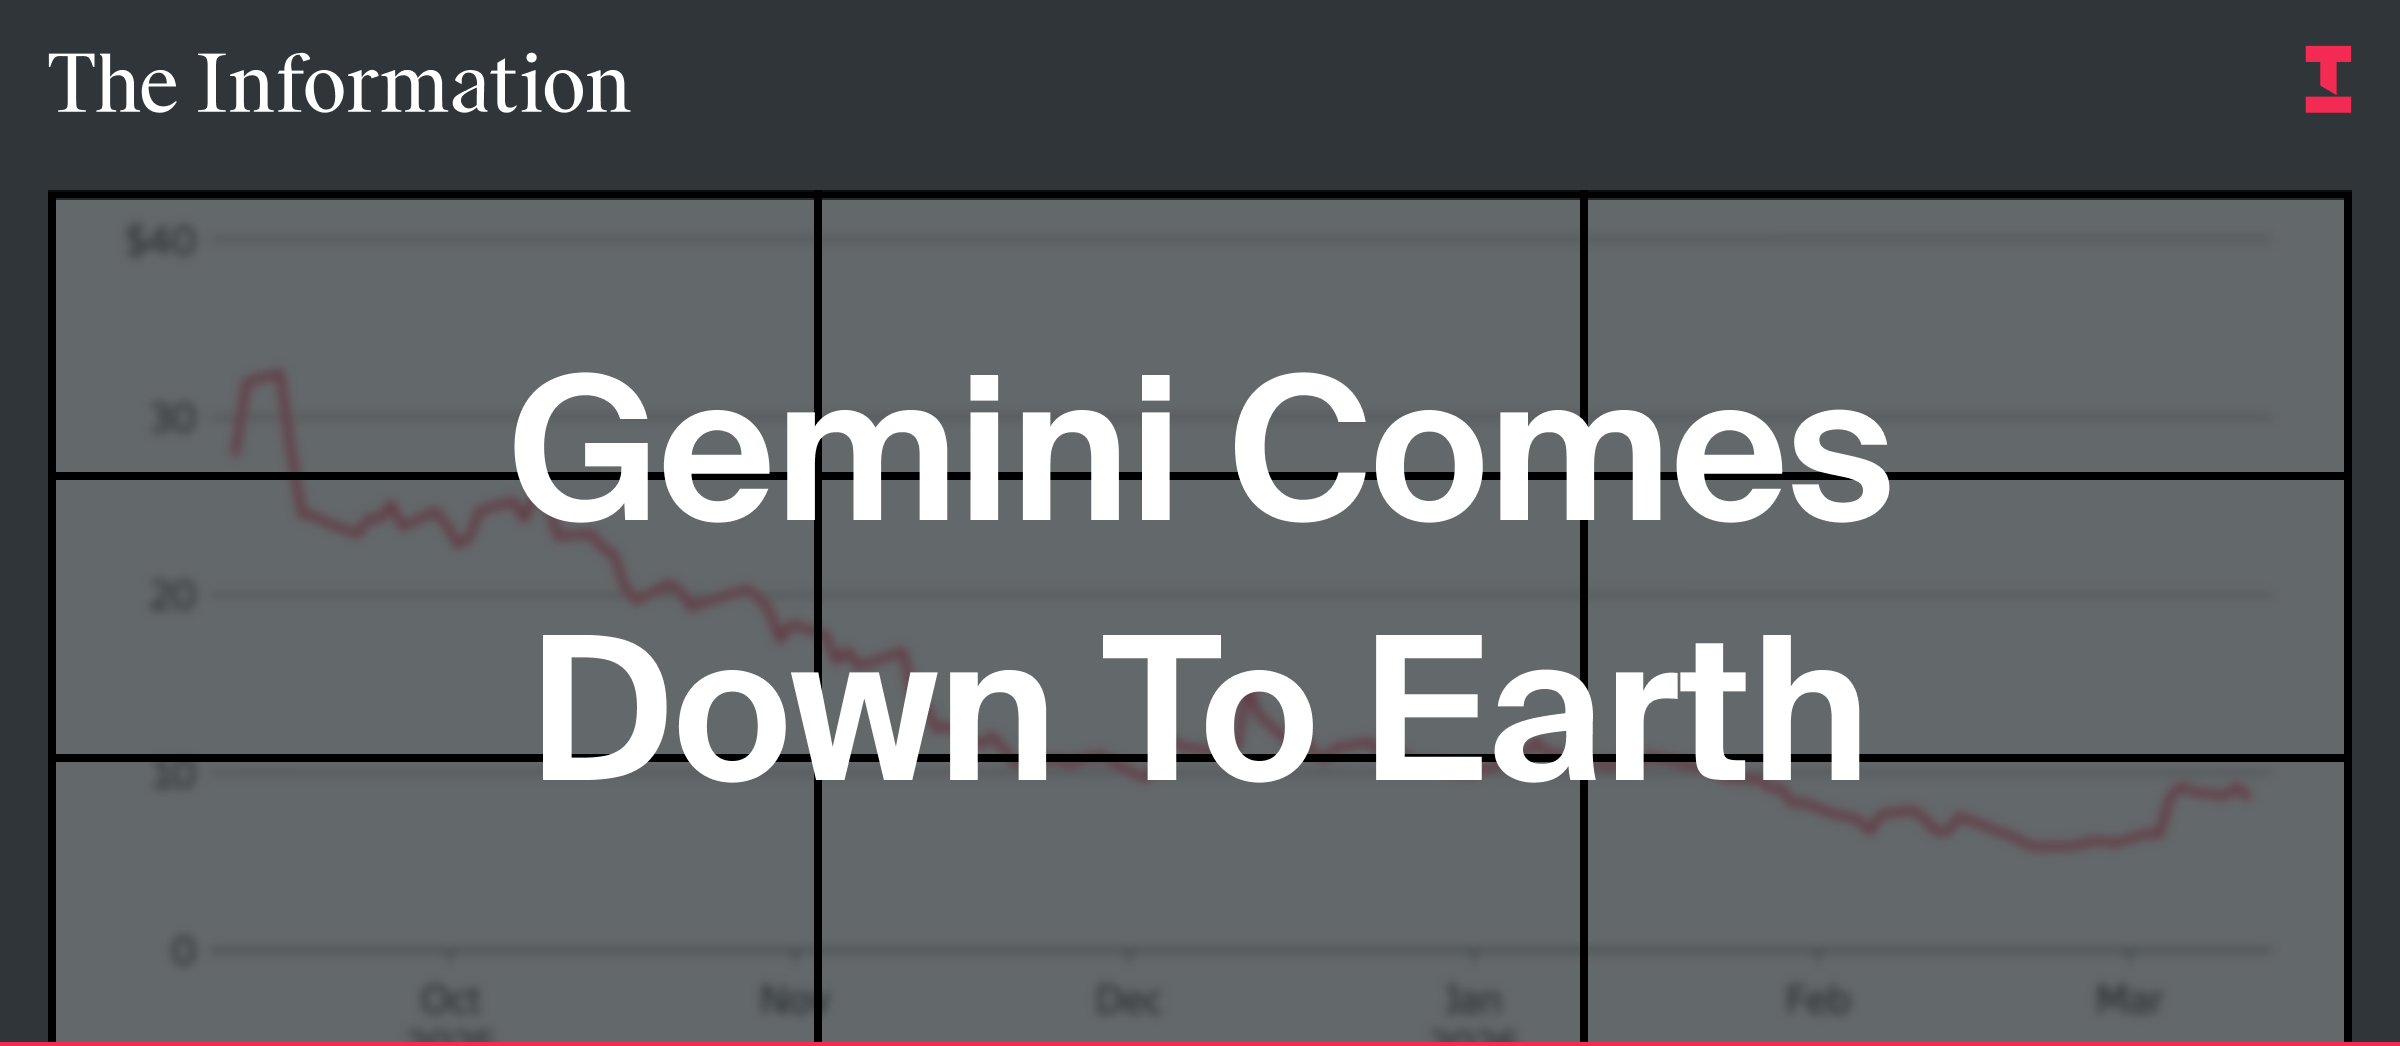
Gemini Comes Down to Earth
This chart follows the crypto exchange's stock since its IPO, which is now worth less than a third of its September listing price.
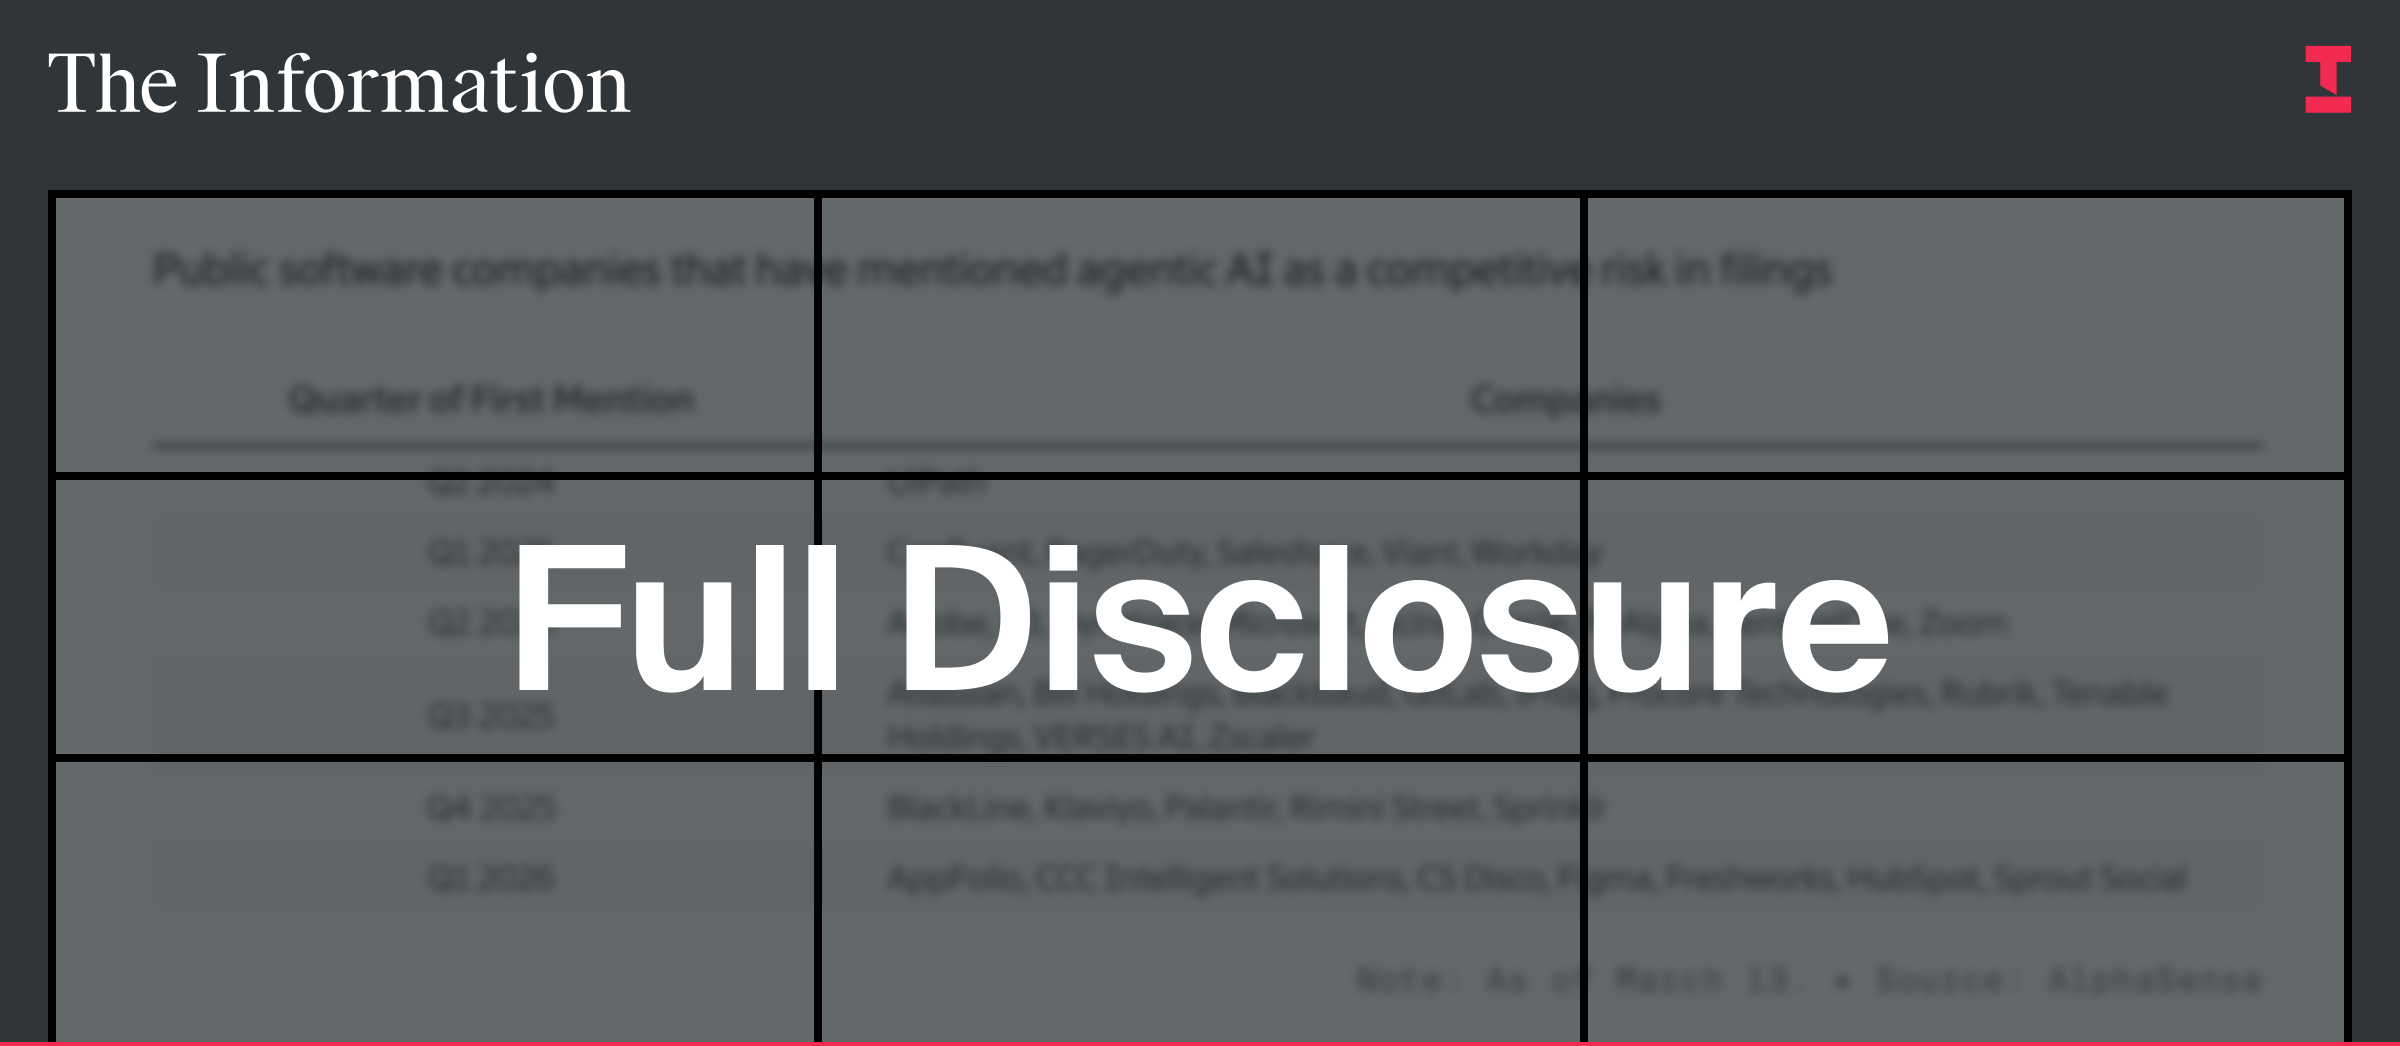
Agentic AI as a Competitive Risk
This chart tracks when public software companies first disclosed agentic AI as a competitive threat in filings, showing a sharp increase in mentions through 2025 and into 2026.
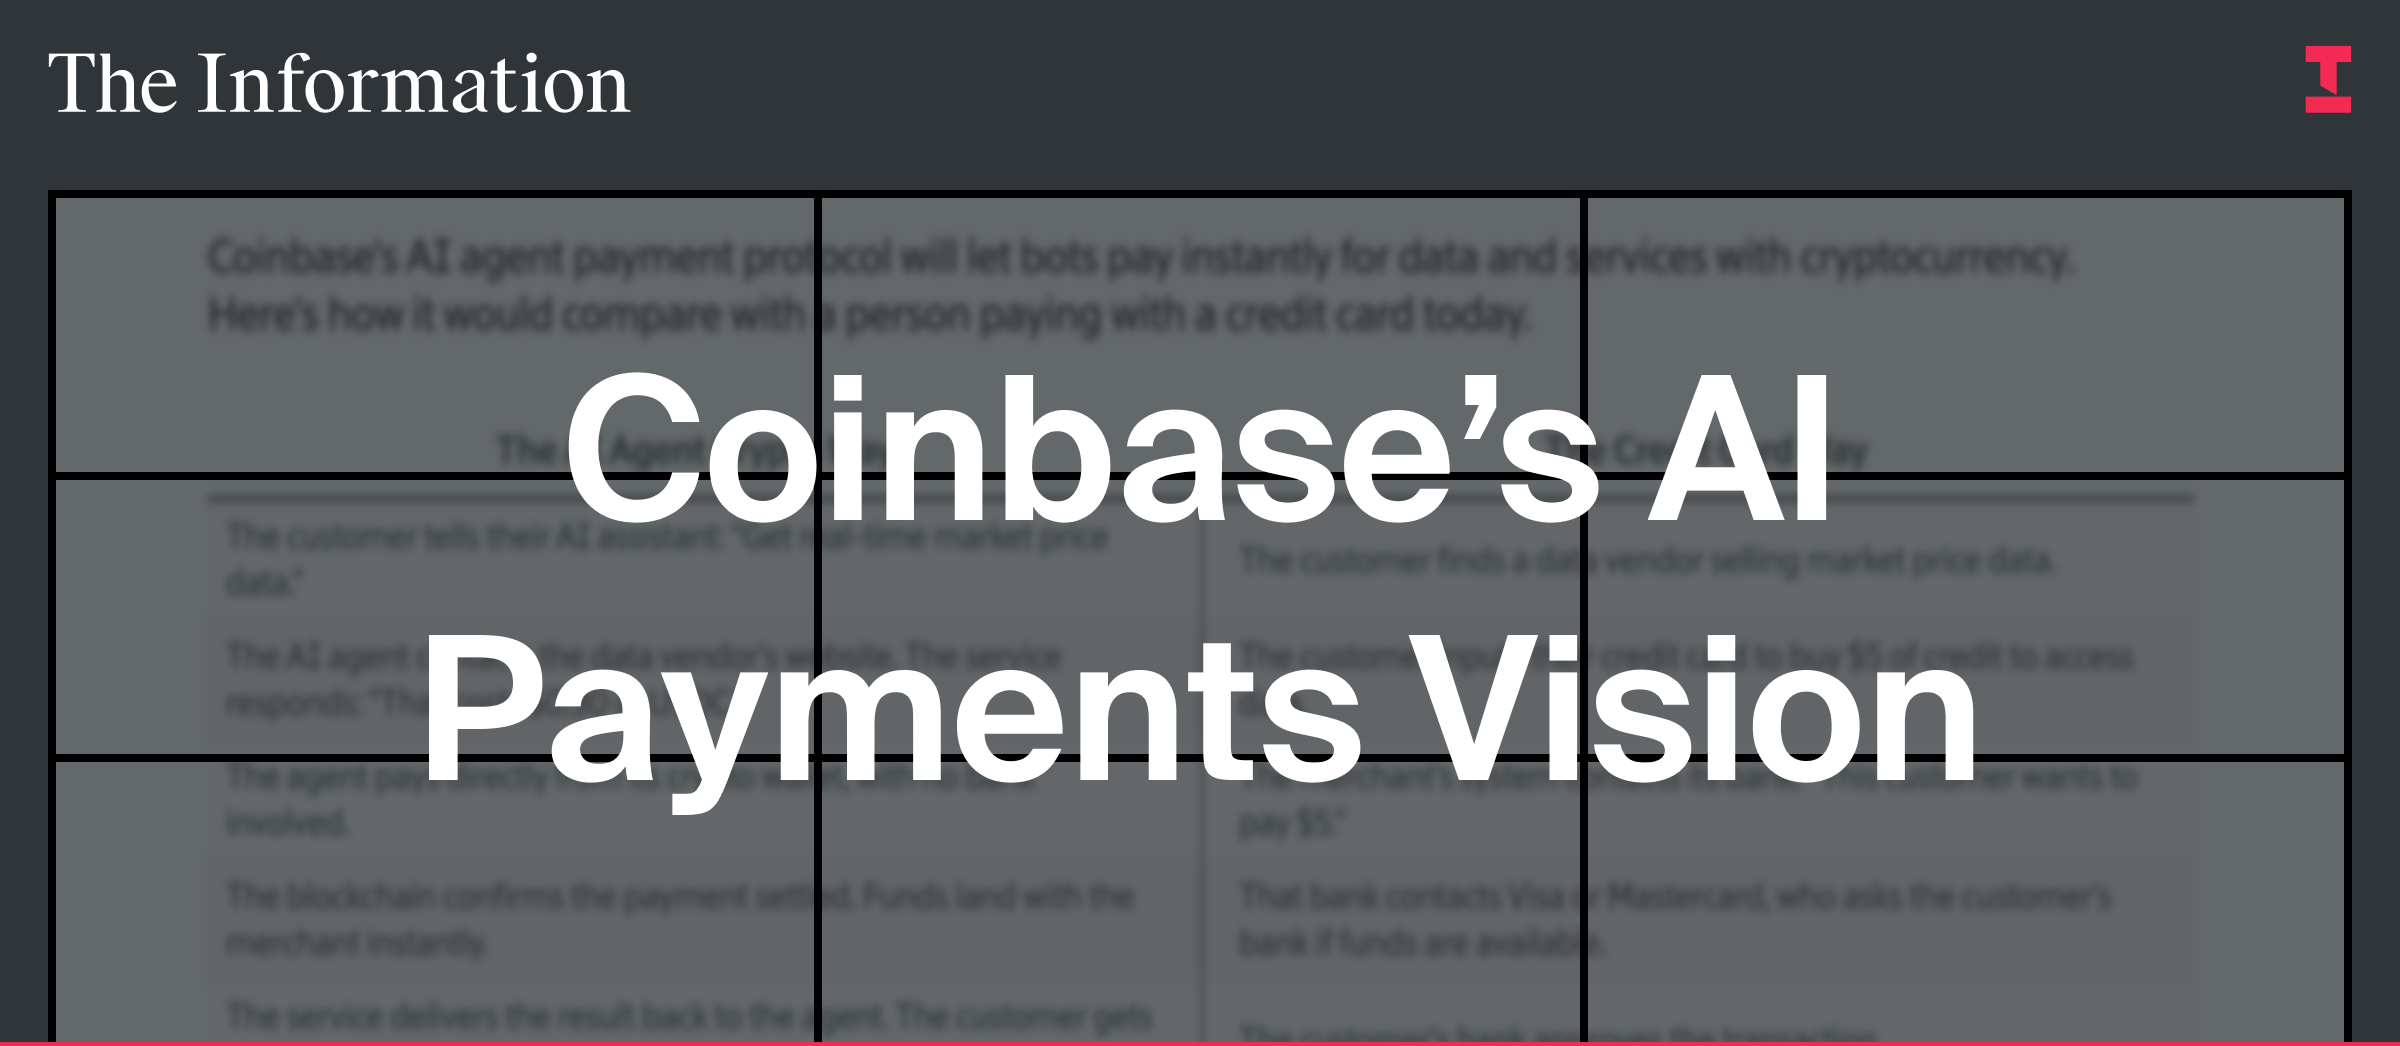
Venture Capital's Full Throttle
This chart compares how an AI agent would complete a payment using crypto with how a person pays using a credit card today, outlining a faster, automated path for transactions between software and services.
Each chart lives on its own page, and is linked directly to the reporting behind it — making it easier to move from data to insight.
To mark the launch of the Charts and Data Library, new subscribers can subscribe for $399 $299 and save 25% on an Annual subscription for the first year of The Information.
If you rely on data to understand where technology and business are headed, this library is designed for you.


0 comentários:
Postar um comentário