
Hello,
We recently launched a a searchable archive of every chart, diagram and data visual published in The Information's reporting. Our charts condense months of sourcing and analysis into a single view — helping explain how competition, valuations and capital are shifting across tech.
Below are three charts from that archive that capture the race for AI revenue, the changing valuation of defense tech and the surge of new venture capital.
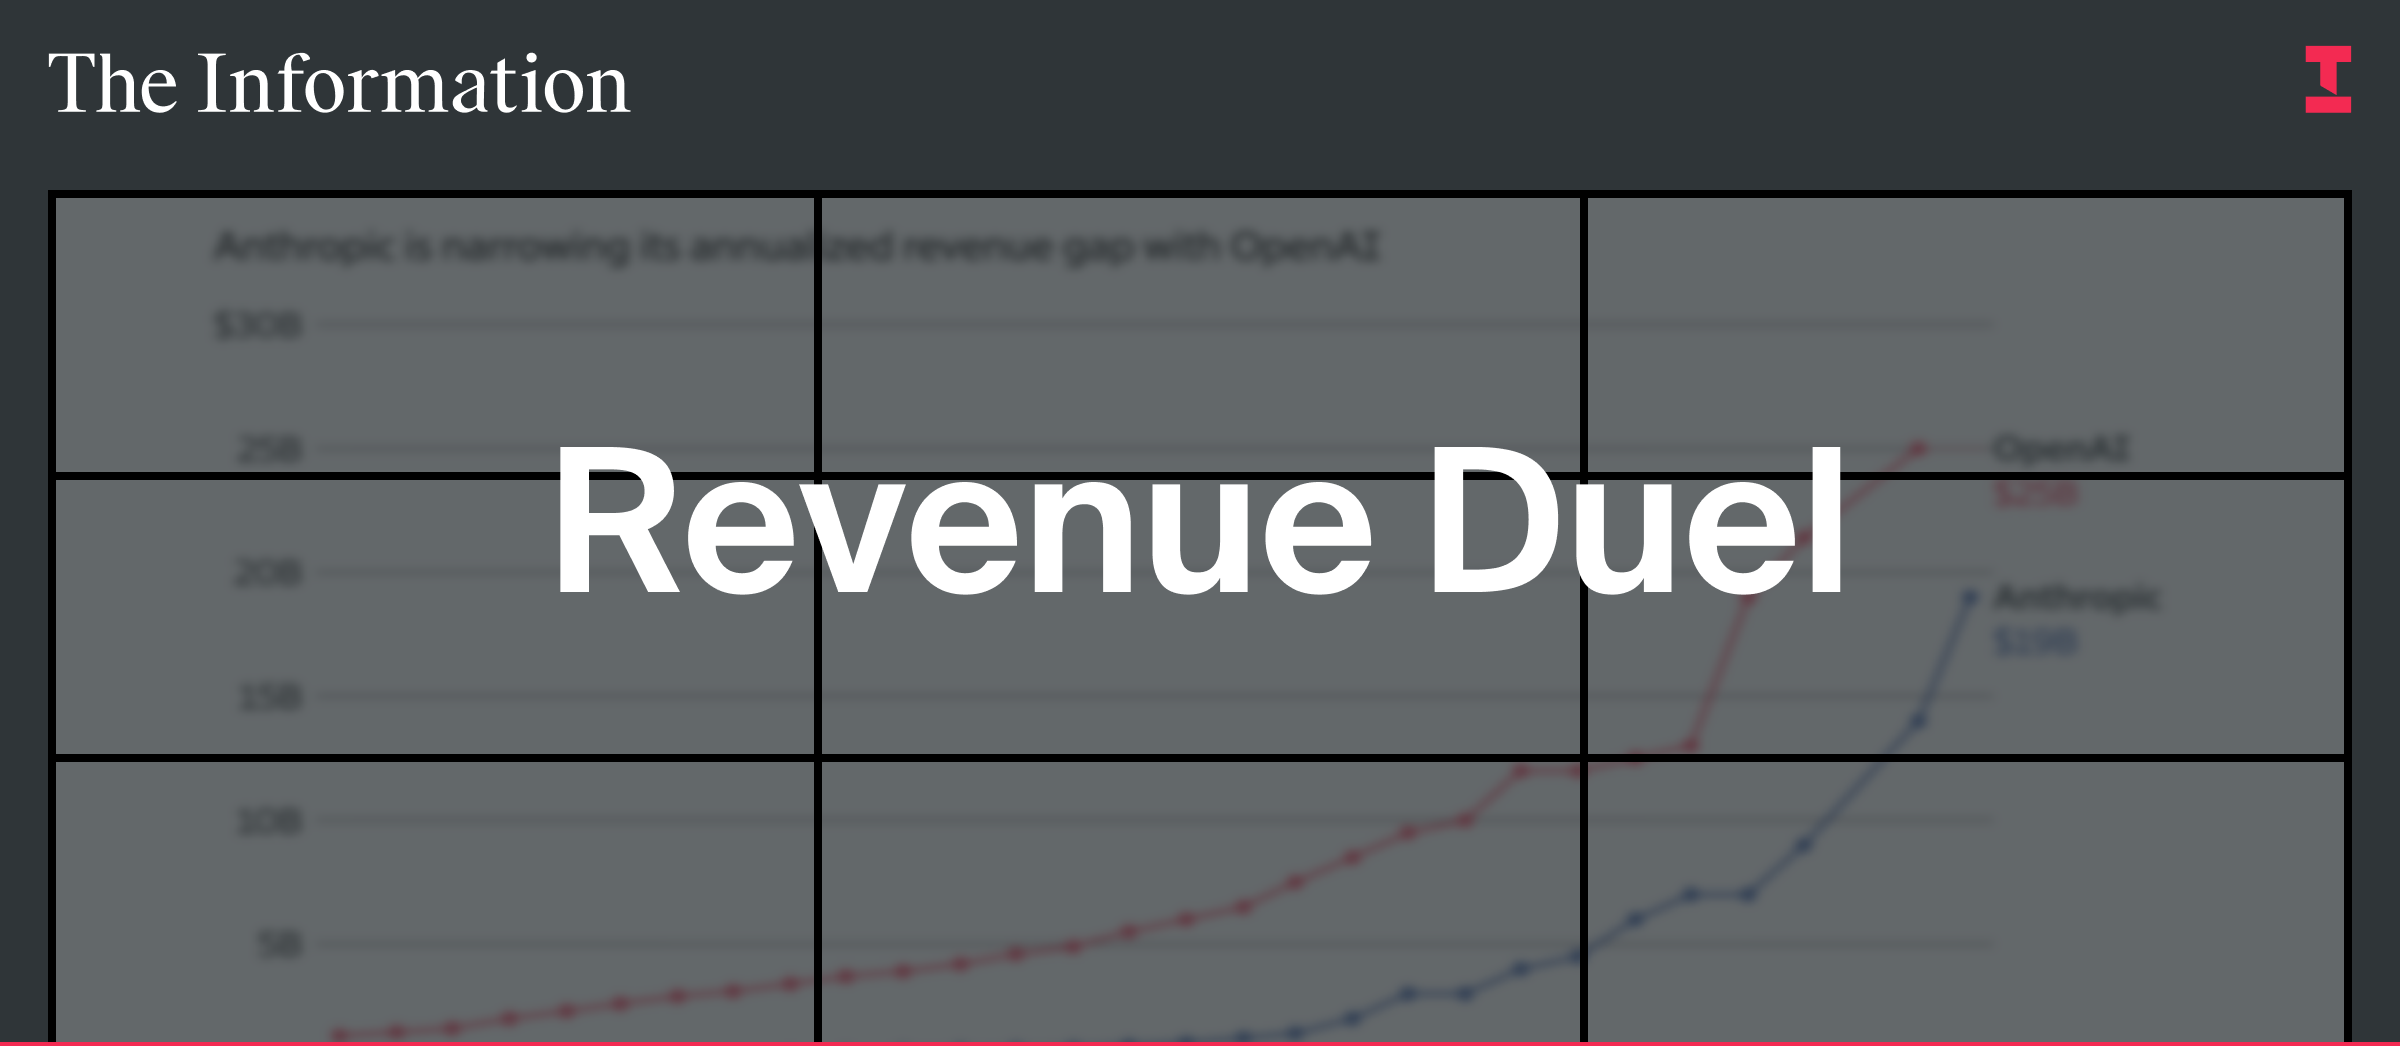
OpenAI vs. Anthropic: The Revenue Duel
This chart tracks the annualized revenue growth of OpenAI and Anthropic. While OpenAI remains far ahead, Anthropic has rapidly expanded revenue and narrowed the gap.
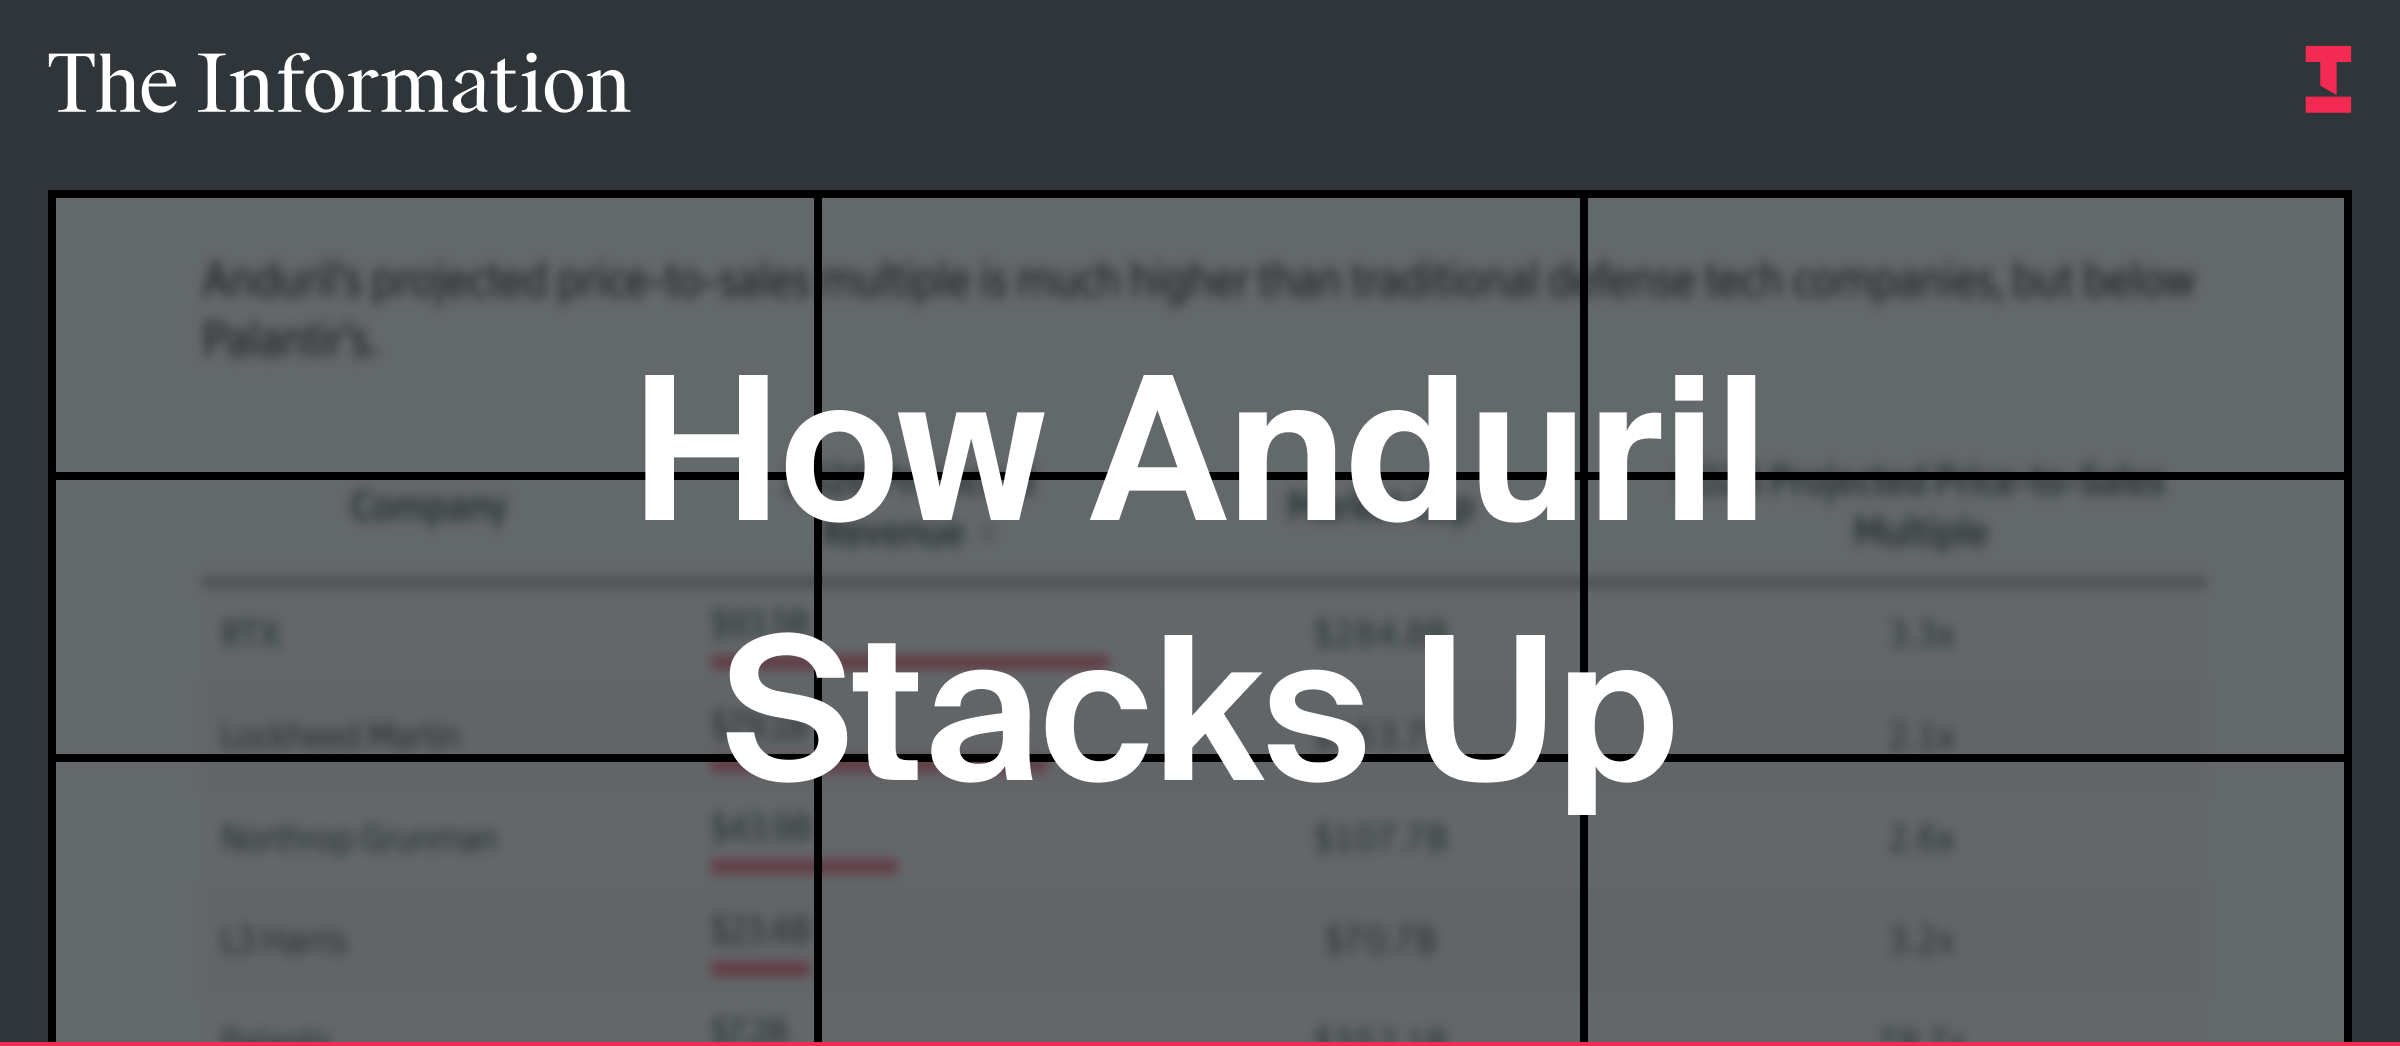
How Anduril Stacks Up
This chart compares Anduril's projected price-to-sales multiple with major defense contractors and Palantir. The company's valuation sits far above traditional defense firms, highlighting how investors are pricing the next generation of defense technology.
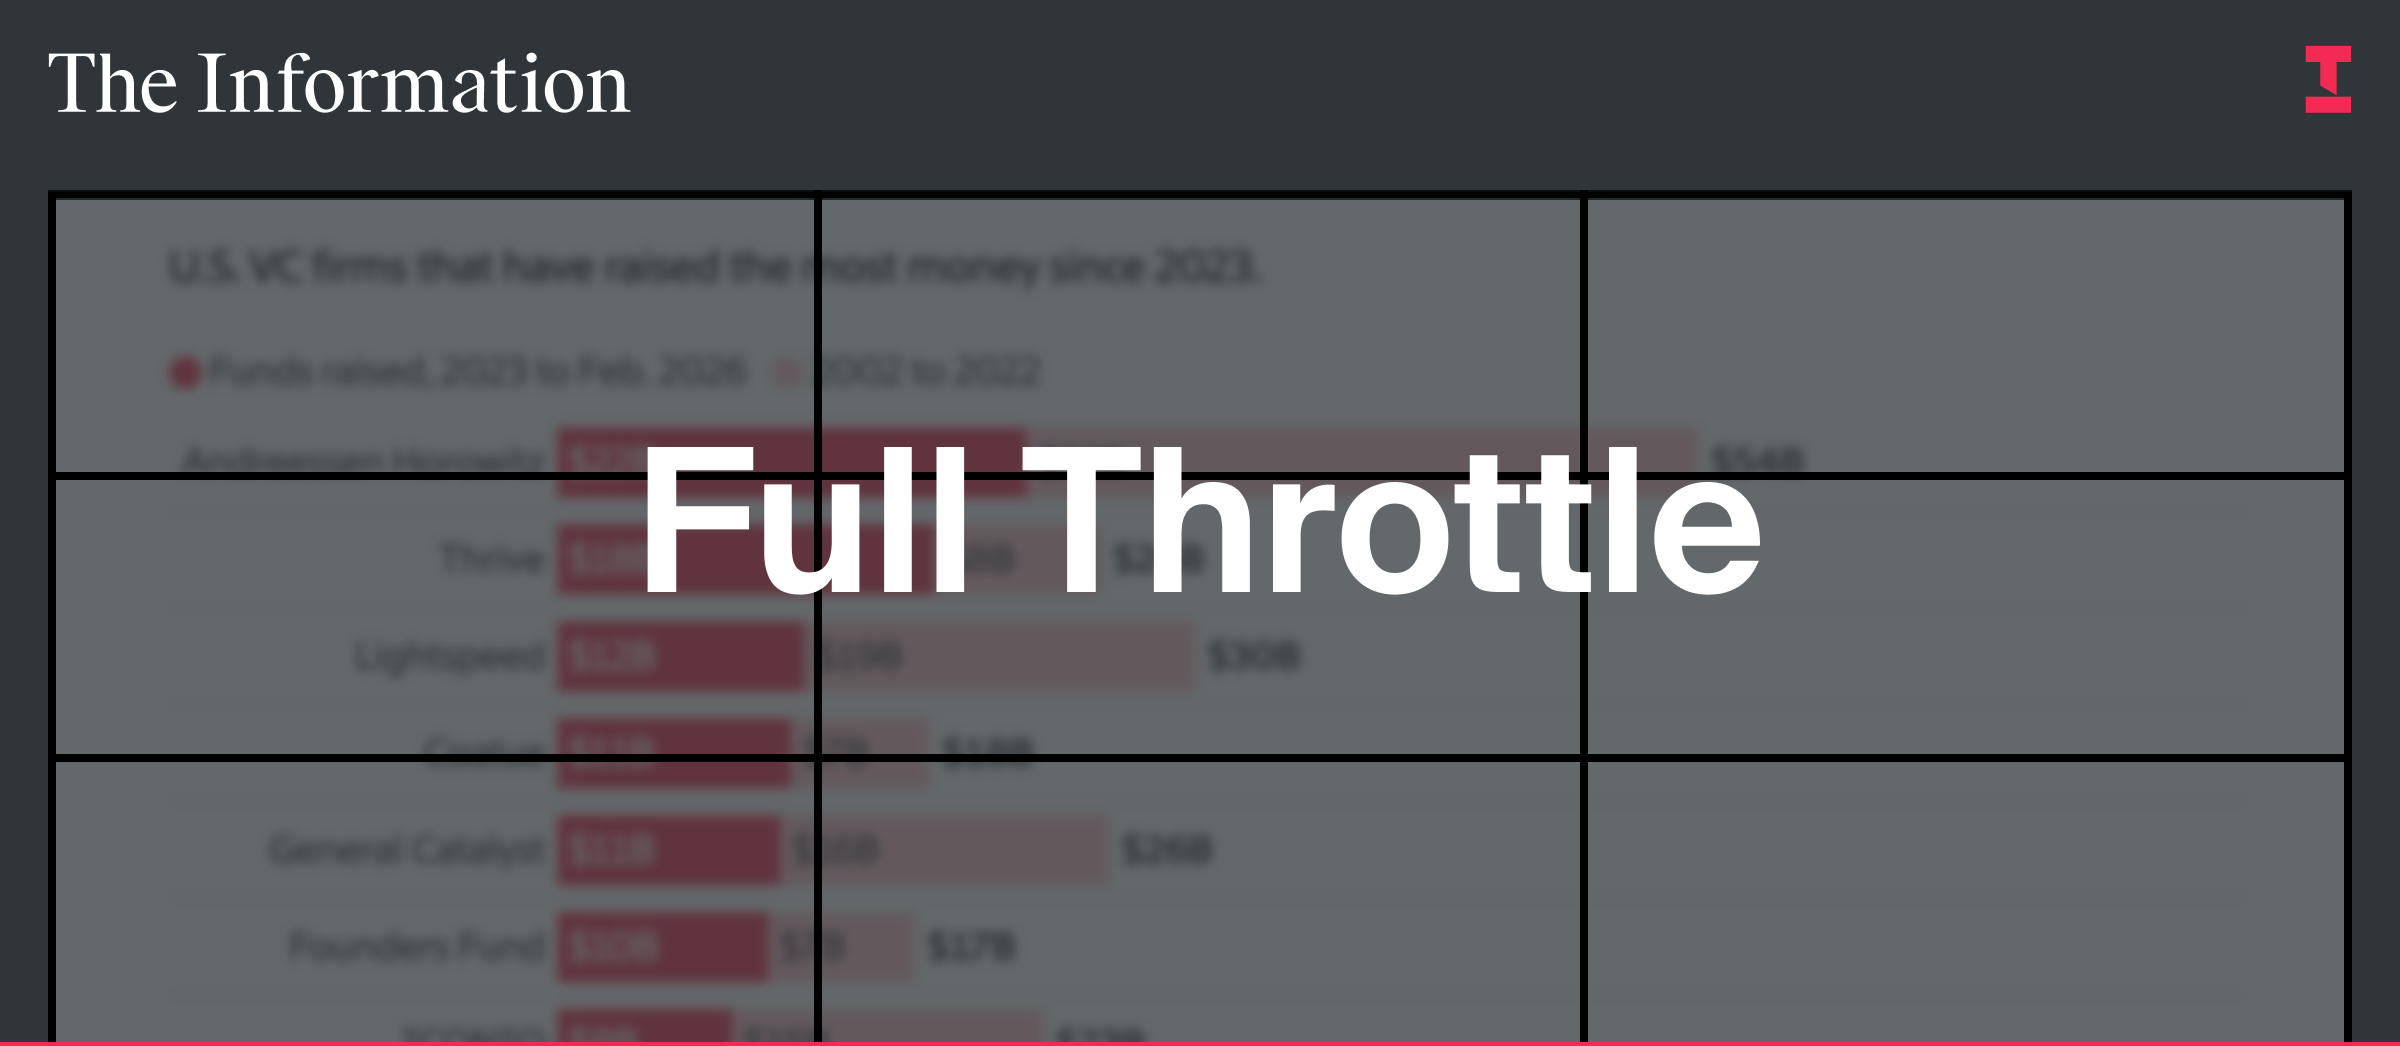
Venture Capital's Full Throttle
This chart shows how much capital major venture firms have raised since 2023 compared with the previous two decades, illustrating the scale of new funding entering the startup ecosystem.
Each chart lives on its own page, and is linked directly to the reporting behind it — making it easier to move from data to insight.
To mark the launch of the Charts and Data Library, new subscribers can subscribe for $399 $299 and save 25% on an Annual subscription for the first year of The Information.
If you rely on data to understand where technology and business are headed, this library is designed for you.








0 comentários:
Postar um comentário